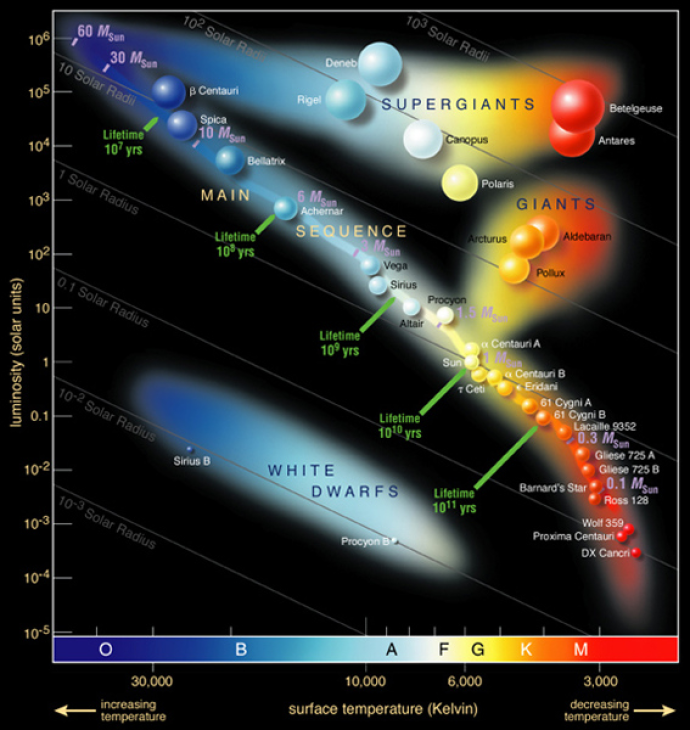
Star clusters are large groups of stars. These clusters provide fantastic (in fact, out of this world(!)) laboratories for us to study populations of stars. From them, we can learn more about how stars evolve and what influences this evolution.
This inquiry-based science project allows you to explore the light from star clusters. Using this data - along with specialist software, colour-magnitude diagrams, data analysis, and critical thinking - you will discover what we can learn from stars and their clusters.
By the end of this activity you will:
- Have used and developed your scientific skills, including forming hypotheses and research techniques
- Know how to view astronomical data and take measurements from it
- Have investigated what we can learn from star clusters using photometry (brightness measurements)
To complete this activity you will need:
IT Equipment
- Access to the internet
- Software that can open astronomical data (details are given in the project pages)
- A spreadsheet package like MS Excel - if you are new to spreadsheet software, use this MS Help Sheet
Files or Documents
Image

Credit
This work
by ESO
is licensed under Creative Commons Zero v1.0 Universal
